
Vendor Stock Sales Data Analysis, Findings & Strategies
At VisionOne, we took on a challenging data analysis project to rigorously demonstrate our expertise and expand our methodological portfolio. Utilizing advanced SQL, our team meticulously handled a large sales dataset, ensuring comprehensive data cleaning and transformation. Subsequently, we leveraged Tableau to craft intuitive and visually compelling charts and graphs. This project, executed to showcase our capabilities, perfectly illustrates VisionOne's skill in transforming complex data into clear, actionable insights – a critical ability we bring to every client opportunity.
Strategy to Achieve Objective
Strategy to Achieve Objective:
• Redshift (Storage)
• Airbyte (Ingestion)
• SQL for Transformation
Transformation Layer (CTE)
• Staging (for data cleaning)
• Country Level Sales
• Country Level Stock
• Sales
• Product Pricing
Dash-boarding
• Tableau Desktop
Stories
• Customers
• Pricing
• Country Performance
• Portfolio Performance
Presentation
• Google Slides
Time Invested
• 4 hours
Derived KPIs based on Assumption
Invoices doesn't have any customer_id translated as Invalid customer Flag.
Invoices that have negative Quantity marked as Negative Invoices else Positive Invoices.
Get the Minimum price ever recorded against each Stockcode to analys it’s lower boundary, same goes with Maximum price for Upper boundary.
Average unit price against each SKU Code, these data points helps to analys the pricing trend against SKUs.
Total sales against each Product, to analys the complete contribution in Portfolio.
Consider first Invoice date against each customer as their first order. After that all of their orders marked as Recurring orders.
Customer Order Placement Analysis
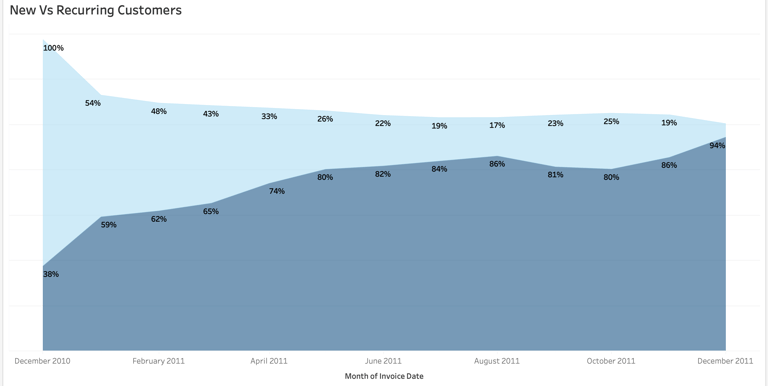
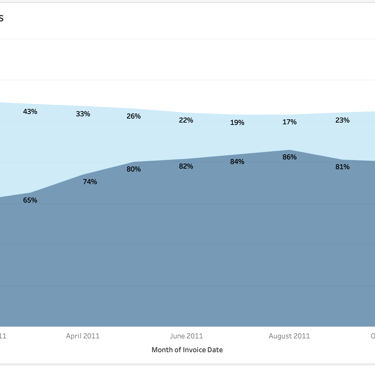
Findings
New customer acquisition is declining.
Old customer retention is improving.
Assumption Reasons
No marketing strategies.
Dependent on organic growth instead of hyper growth.
Low customer engagements
Suggested Actions
Re-engage old customers with targeted marketing.
Adjust marketing strategies for new customer growth.
Enhance overall customer experience.
Consider loyalty programs for retention.
Focus on AARRR (acquisition, activation, retention, referral & revenue)
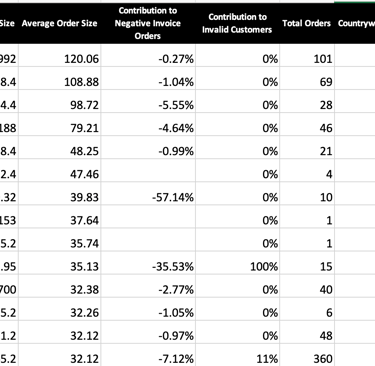
Portfolio Performance

Out of 4045 StockCodes there are only 737 SKUs that are generating the 80% revenue which are present in average 11.01 Countries and remaining 20% are available in average 3.75 countries.
Invoice to Customers reach ratio of top 10 Contributed stock codes that are relatively too high i.e > 3 and their inductions are 30% in the countries out of our total presence 39 Countries)
Plan out the penetration of stockcode that are the part of 20% contribution but in hight demand of customer base. Averagely they are available in 10 Countries out of 39.
Assumption Reasons
Service addressable market is low.
Increase the penetration of stocks in likelihood culture countries to increase revenue, choices and competition.
Suggested Actions
Introduce stocks in more locations where high contributors SKUs are already in demand.
Start promotions to gain more customer base.
Wallet Share by Country
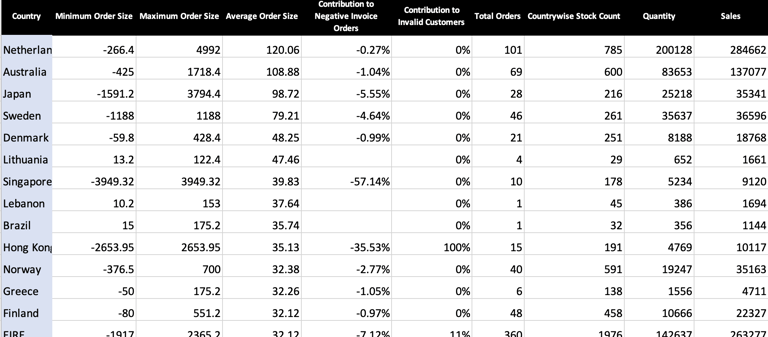
Findings
Service addressable market is low.
Increase the penetration of stocks in likelihood culture countries to increase revenue, choices and competition.
Assumption Reasons
High purchasing power parity.
Total Addressable market is high.
Suggested Actions
Inject low contributor Stockcodes from portfolio that have high customer reach to increase their panetration and demands.
Intorudce high margin product into these countries to gain more margins. Since their purchasing power is strong.
Develop market engagement such as loyality, refferals program to maintain retention rate & avoid churn.
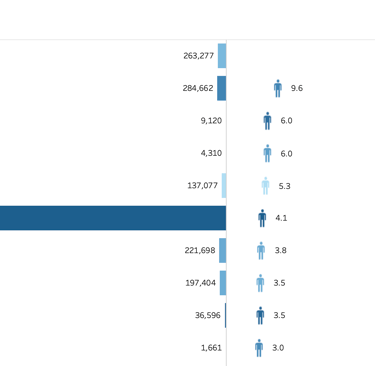
Invoices to Customer Ratio w.r.t Growth
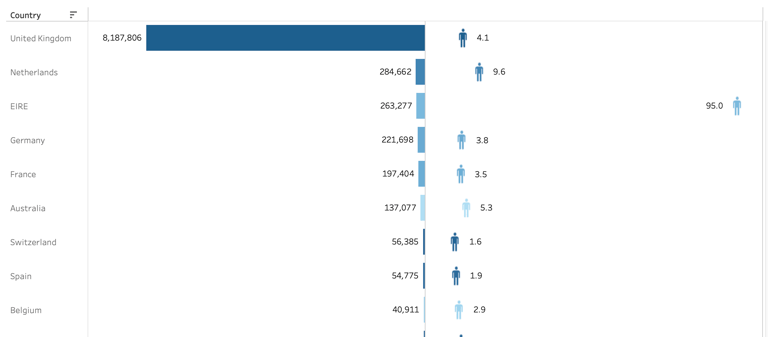
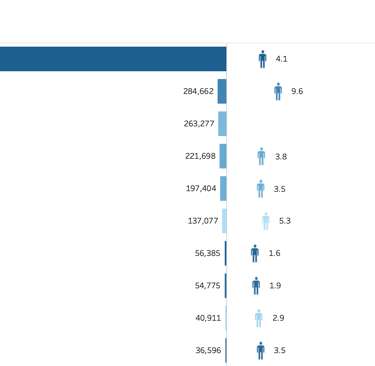
Findings
Countries with high sales mostly have low Orders to Customers Ratio.
That is the sign that our most of the portfolio is based on particular base of customer.
That is result in slow growth of Business.
Suggested Actions
Customers Loyalty & retention is really good for Business image and it provide a sustainable growth and profits on long term, however increasing the reach to become a global impact should be necessary before another competitor gets the share on market.
Introduce upselling or cross selling to current base of customer to generate more revenue streams from existing ones.
Introduce Promotions, discounts & loyalty program to reduce the churn rate.
Measures
Total Sales by Country Total Customers: Distinct Count of Customers Total Invoices: Distinct
Count of Invoices Ratio: Invoices / Customers
Invoices to Customer Ratio w.r.t Reach/Engagement
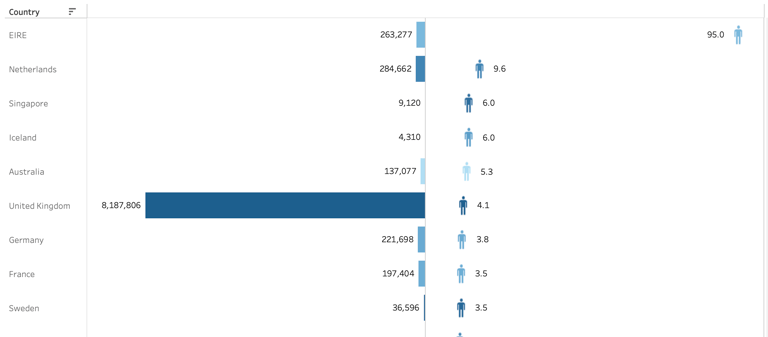
Findings
Certain SKUs reaches high prices as compared to their average unit prices.
That might be the glitch in business process or purchasing pattern.
Suggested Actions
Create the price control process or triggers that immediately let the system knows if the price of SKU crosses the certain threshold.
Study out the purchasing behaviour of customers based on the frequently changes in pricing of certain SKUs.
Develop the control on Stock prices before on boarding them, so that margins will be under control.
Insights
Analytics
Experts
info@visiononeanalytics.com
+92 03132889646
© 2025. All rights reserved.