
Tableau Data Project
VisionOne partnered with ExecOnline, a US-based client, on a comprehensive data visualization project. Our team created intricate dashboards with complex visualizations, specifically designed to provide in-depth insights for data-driven decisions.
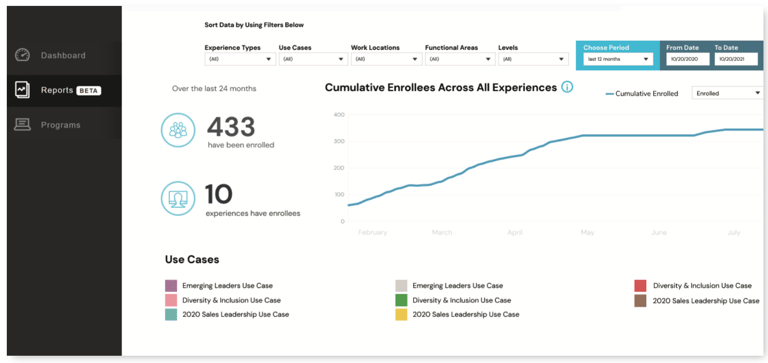
Design 1
VisionOne led a dynamic Tableau visualization project for a US-based client, collaborating closely with their cross-functional team. The project spanned four weeks, encompassing design understanding, development, System Acceptance Testing (SAT), User Acceptance Testing (UAT), and comprehensive client presentations
Key Achievements:
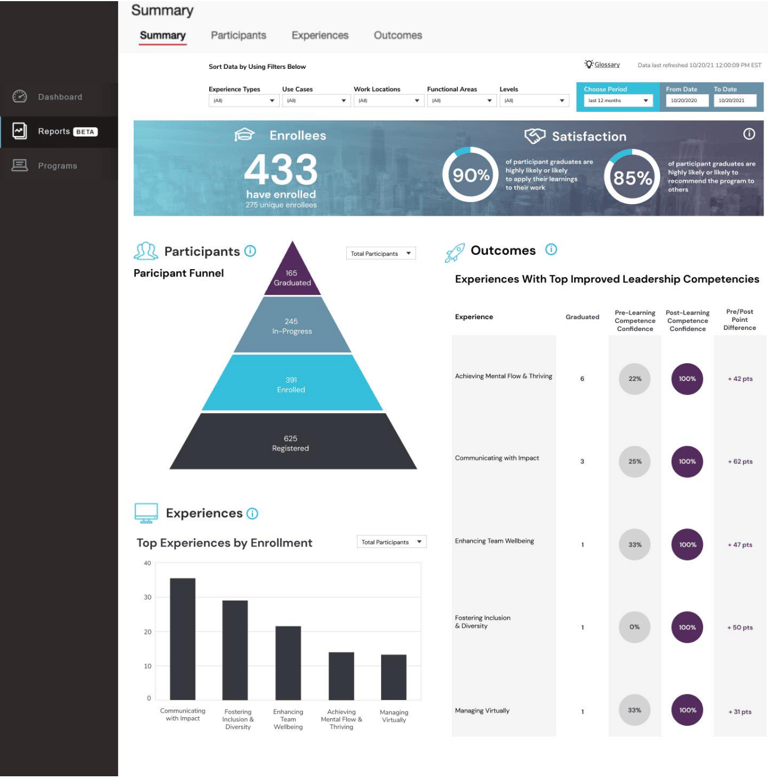
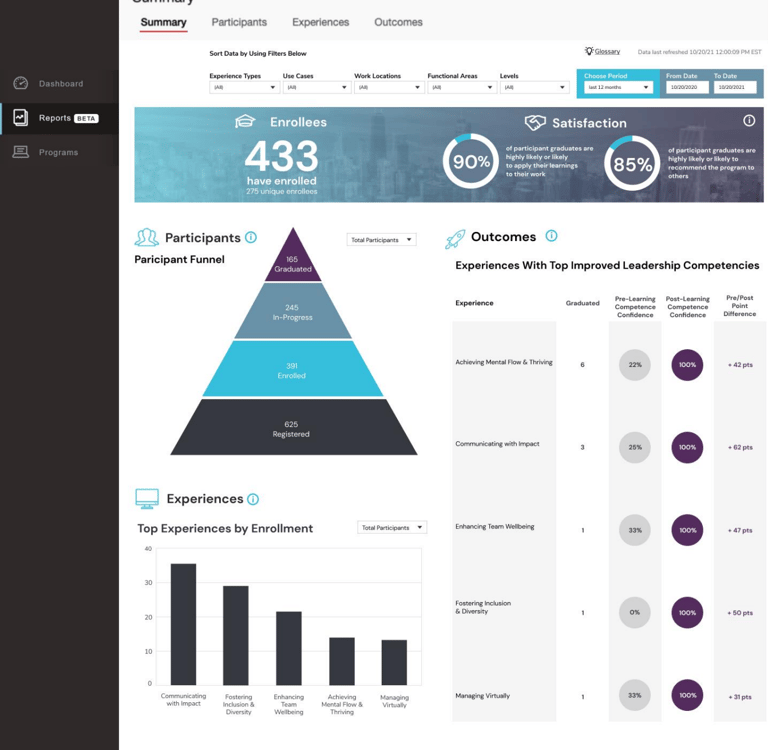
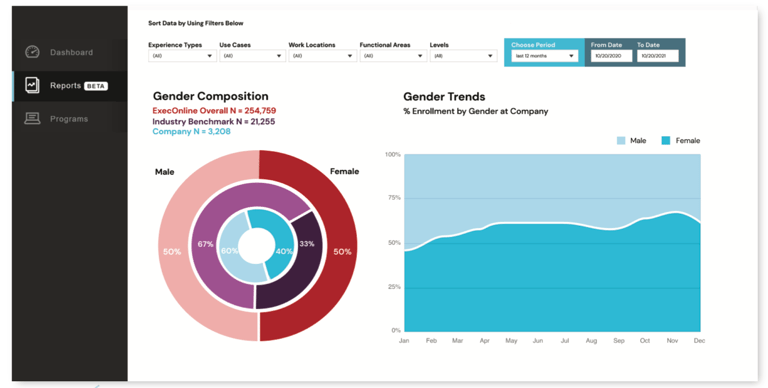
Wireframe Conversion: Translated a complex wireframe provided by the client on Figma into a Tableau dashboard, adhering to their organisational standards and design guidelines.
Data Visualization: Designed and implemented intricate visualizations, including calculated fields for ratios and KPIs, to provide the client with clear, actionable insights.
Interactivity: Developed drill-down functionality, allowing users to explore aggregated data down to the granular level of detail, enhancing data exploration and decision-making capabilities.
Download Options: Incorporated features that enabled users to download visuals in PDF and CSV formats, ensuring accessibility and flexibility in data sharing.
Team Collaboration: Worked alongside a Scrum Master and a Business Analyst, ensuring seamless coordination and alignment of project objectives.Write your text here...
Design 2
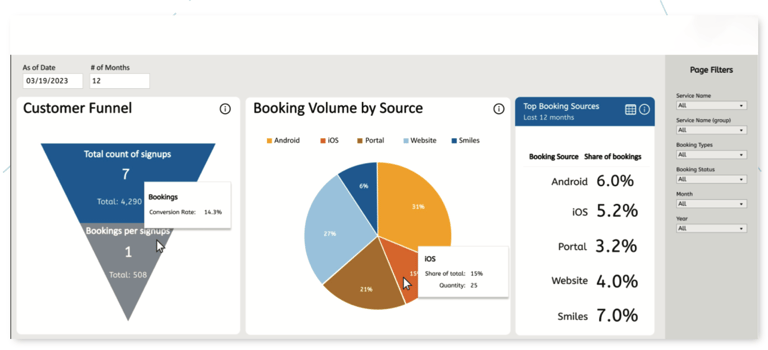
VisionOne spearheaded a dynamic Tableau visualization project aimed at customer segmentation analysis. This initiative involved close collaboration with a skilled business analyst, precisely executing data stories and visualization guidelines provided through Figma. Over the course of one month, our responsibilities encompassed comprehensive data preparation, implementation of calculation analyses, and the application of complex formulas to derive crucial Key Performance Indicators (KPIs).Write your text here...
Key Achievements:
Translated Figma-based visual expectations into interactive Tableau dashboards, achieving precise visualization of customer segmentation insights.
Managed data filtering, aggregation, and transformation to address diverse business use cases while ensuring data accuracy and integrity.
Collaborated with cross-functional teams to align Tableau visualizations with business objectives, resulting in actionable insights crucial for strategic decision-making.
Demonstrated exceptional Tableau development skills, showcasing an ability to meet project goals within the designated one-month timeframe.
Below are some examples of VisionOne's Tableau visualizations created for various clients

Insights
Analytics
Experts
info@visiononeanalytics.com
+92 03132889646
© 2025. All rights reserved.