
Data Reporting Using AWS Quicksight
This portion showcases VisionOne's expertise in Data Storytelling and Dashboard design, primarily utilizing AWS QuickSight as the Visualization Tool. Our designs include comprehensive C-Level Summary Reports, alongside detailed Business Performance Activity stories.
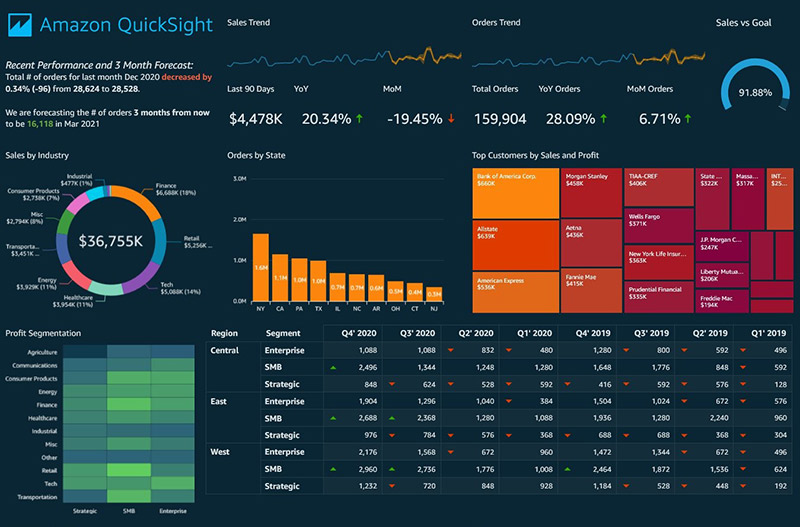
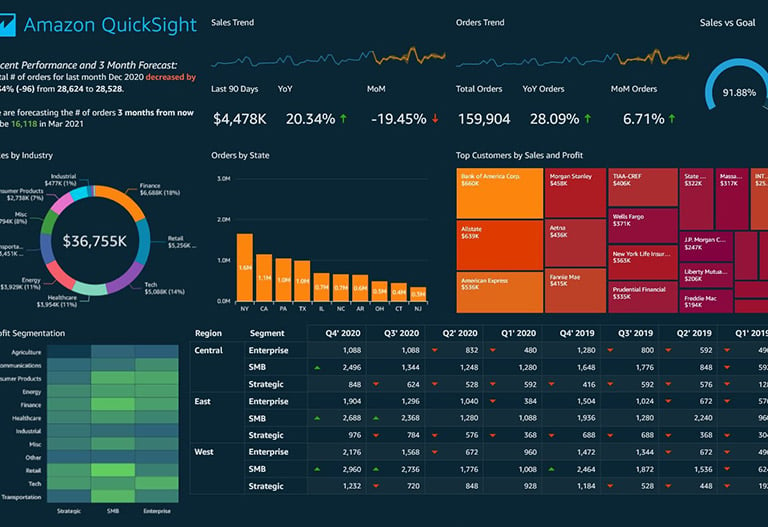
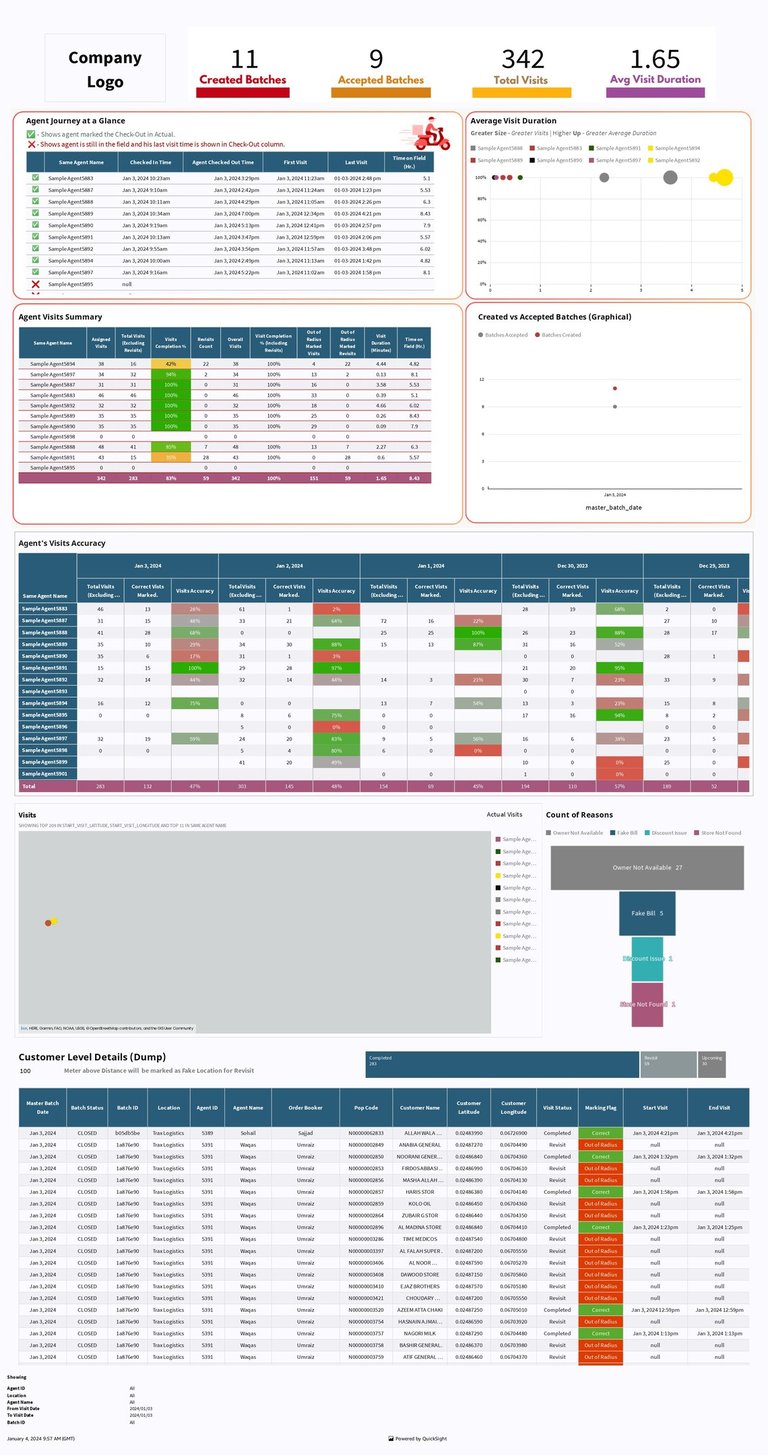
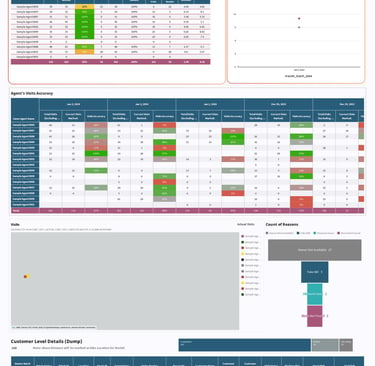
DATA STORY 1
The very first left side dashboard design was developed for SAAS client to show their delivery performance and effiency from their different business units, so that they can easily track the potentials, efficiency and process implementations in a glance. This story also enable the Higher management to track how their business is performing globally, as well as week on week comparison.
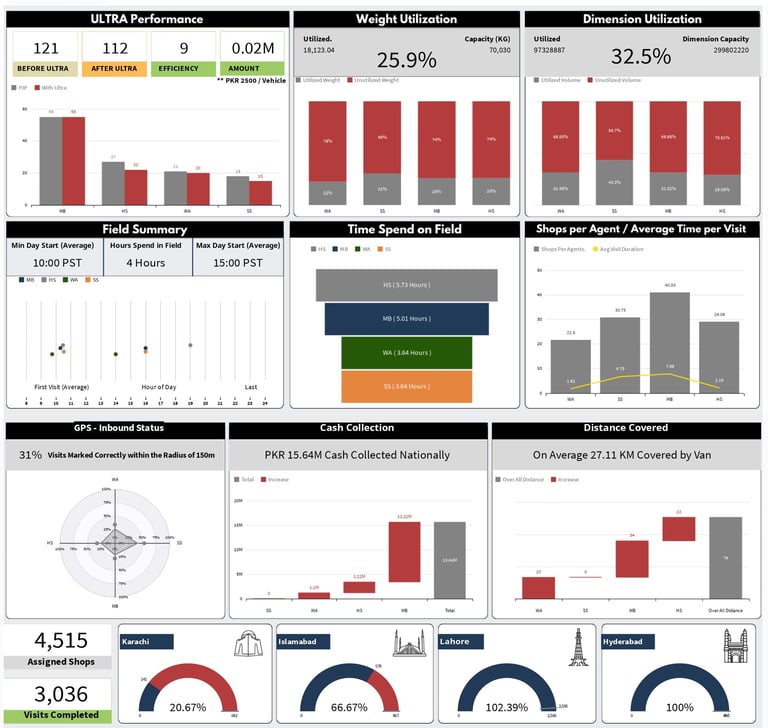
DATA STORY 2
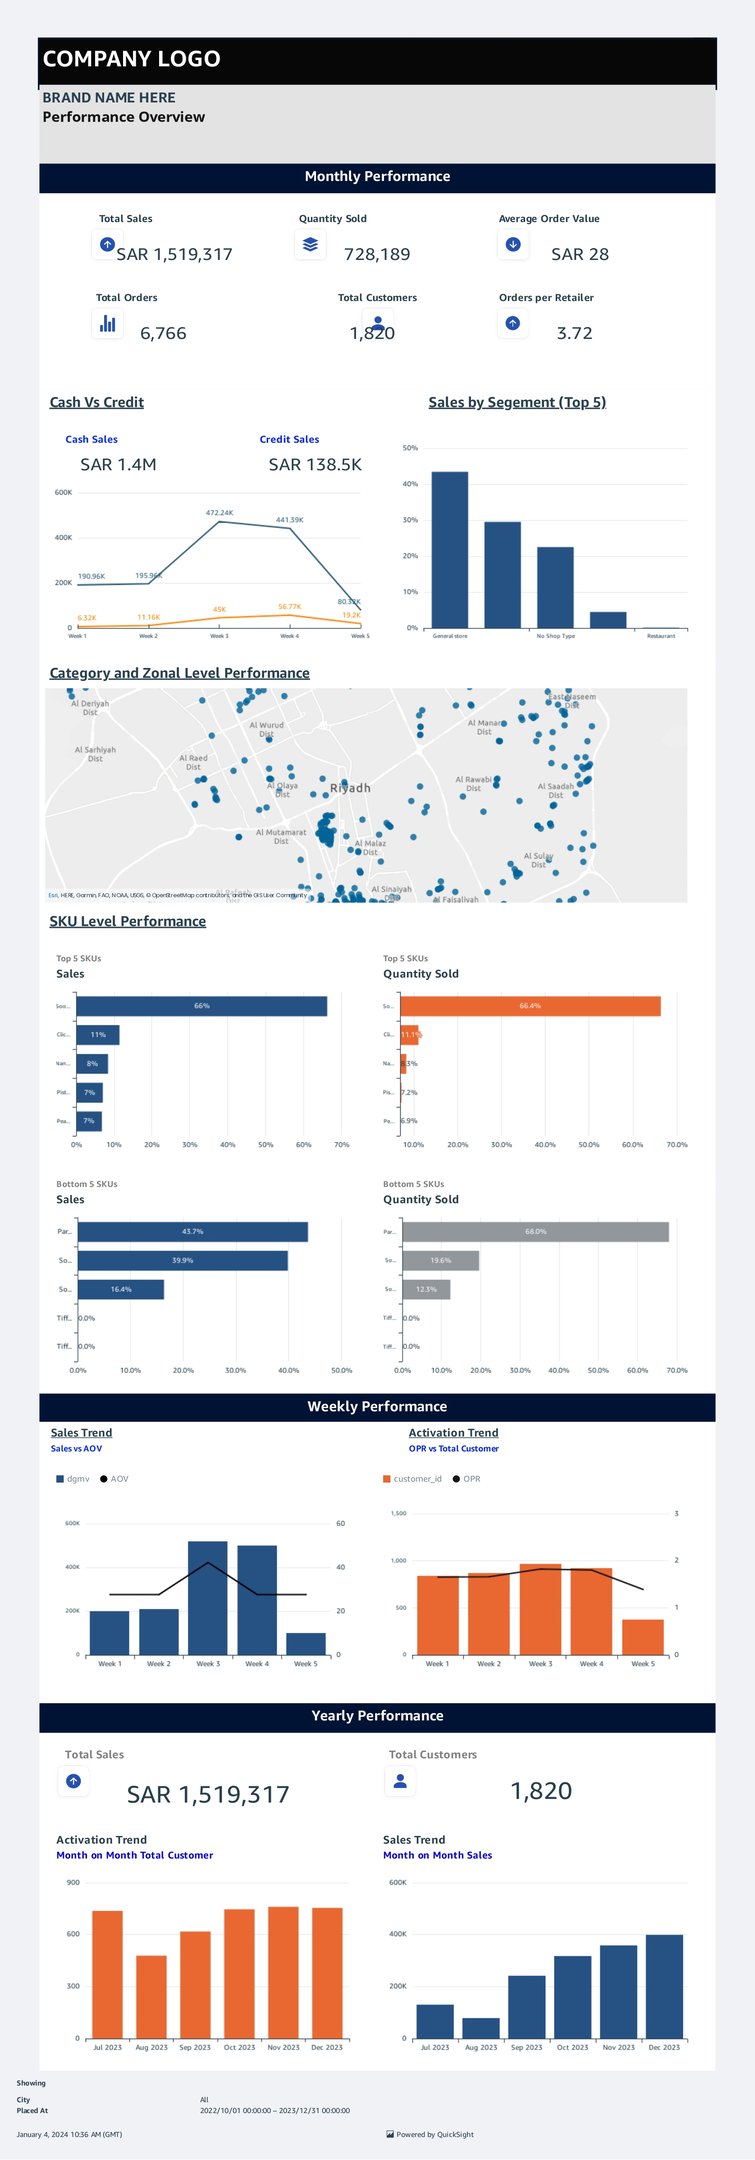
The right side visual shows the performance summary of a B2B customer which shows that how well or worst customer is performing with using KPIs. Map feature help us to evaluate the Reach of customer in a glance. However Percentages Cards would make more easy to evaluate uing standard pattern for all.
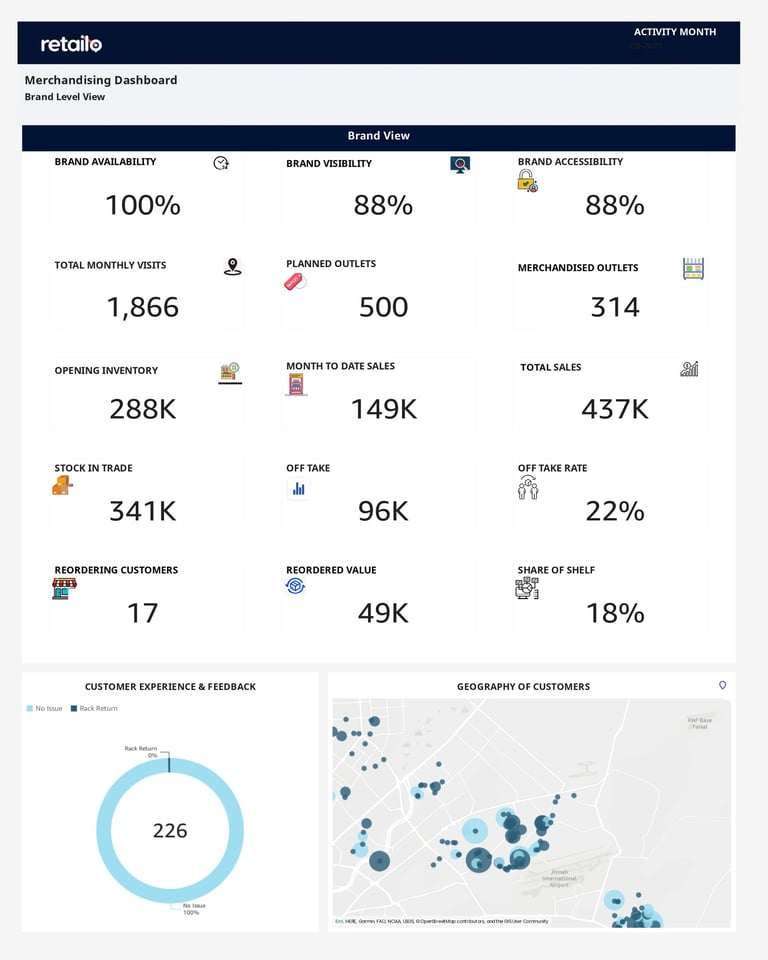
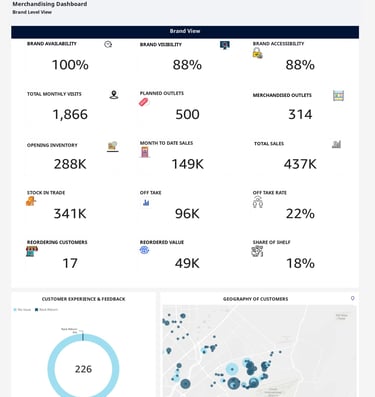
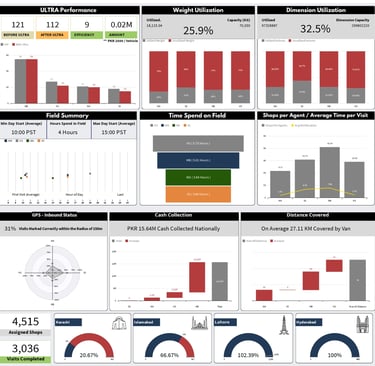
DATA STORY 3
The right side visual shows the performance summary of a B2B customer which shows that how well or worst customer is performing with using KPIs. Map feature help us to evaluate the Reach of customer in a glance. However Percentages Cards would make more easy to evaluate uing standard pattern for all.
Insights
Analytics
Experts
info@visiononeanalytics.com
+92 03132889646
© 2025. All rights reserved.