
Case Study Presentation : User App Journey Analysis
VisionOne partnered with a client to enhance their application by deeply understanding user behavior. Our analysis involved segmenting diverse user groups to identify distinct behavioral patterns and strategize improvements tailored to their needs. The objective was to boost user engagement, foster app growth, build user trust, and improve retention, ultimately driving long-term success for the application.

Problem Statement
For a client seeking to enhance their app experience, VisionOne embarked on a project to thoroughly understand user behavior as a crucial facet of product analytics. Our objective was to decipher diverse customer activities across various segments, enabling the client to craft strategic plans. By delving into these insights, VisionOne aimed to boost engagement, drive growth, foster reliability, and secure long-term customer retention for the client
Tools & Audience
Data Tracking: Firebase was employed for comprehensive user activity tracking within the app.
Data Modeling: The process of data modeling was executed using DBT (Data Build Tool), facilitating the creation of structured and organized datasets.
Data Warehousing: The final data model found its home on AWS Redshift, providing a robust and scalable data warehousing solution.
Data Visualization: For the presentation of insights, AWS QuickSight served as the data visualization tool, offering intuitive and dynamic dashboards.
Target Audience: The designed dashboard primarily catered to key stakeholders, including Marketing, Strategy, Planning, and Growth teams.
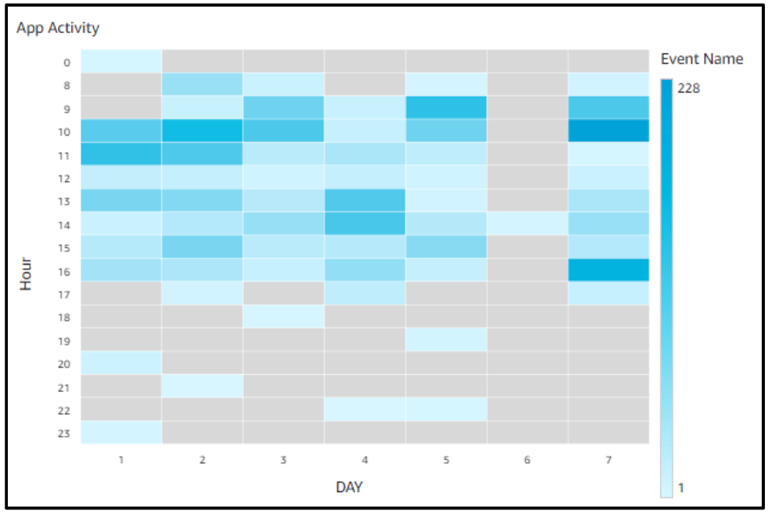
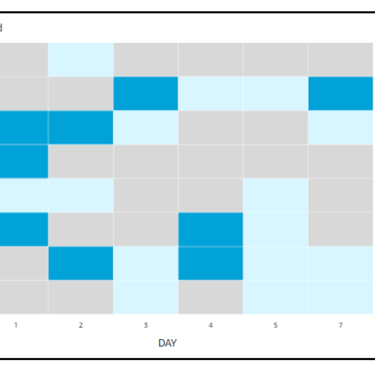
Visual Analysis - Day and Time Heat Map (App Events)
The insightful heat map showcases the dynamic patterns of app events throughout the week, highlighting the specific hours each day when customers engage with the application. Notably, the peak usage period spans from 10 am to 4 pm. A noteworthy observation is the absence of activity on the 5th day, suggesting a potential off-day or reduced engagement during that period. This visualization provides an efficient snapshot of app traffic flow, aiding in strategic planning for optimized user interactions.
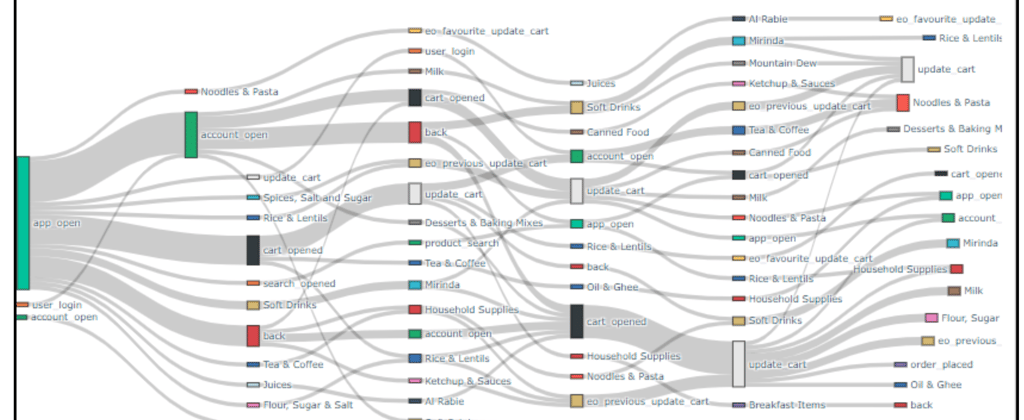
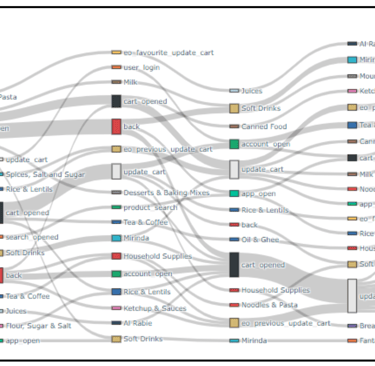
Day and Time (Order Placement Trend)
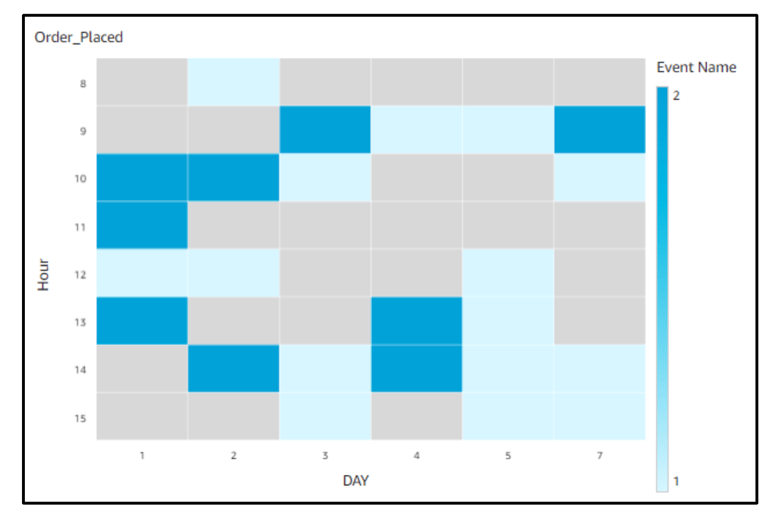
This visual pinpoints when customers prefer placing orders, helping us fine-tune push notifications. It's our cue to stock up on their favorite items, ensuring a seamless shopping experience. In case something's not available, we suggest similar, budget-friendly options to keep them happy and prevent them from looking elsewhere. Simple strategies for a satisfied customer!
test Hi all,I lost my job 1 month ago due to a layoff,Don’t ignore this post please. Even if you don’t have an opportunity for me.I have 1 year of experiences as a product UI developer + Technical product manager in MaxAB.2 years working as a freelancer frontend developer.I am looking for a new position as Technical PM , Data analyst or Frontend developer.If you have an opportunity please leave a comment.Thank you...
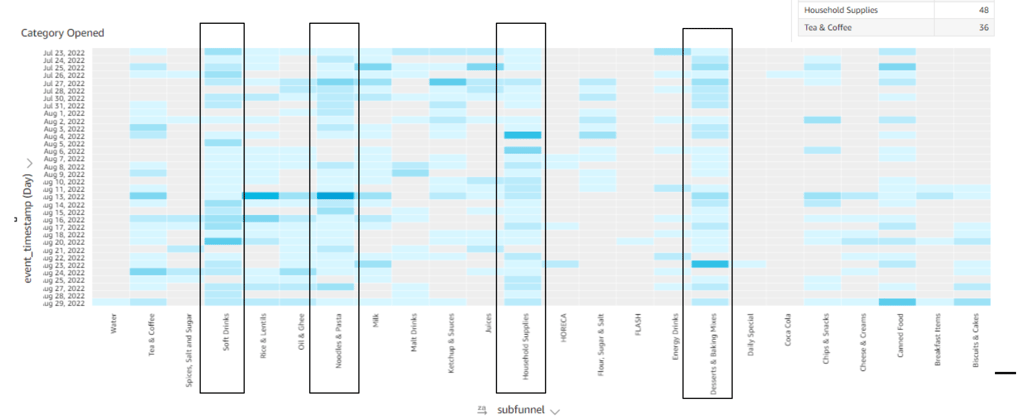
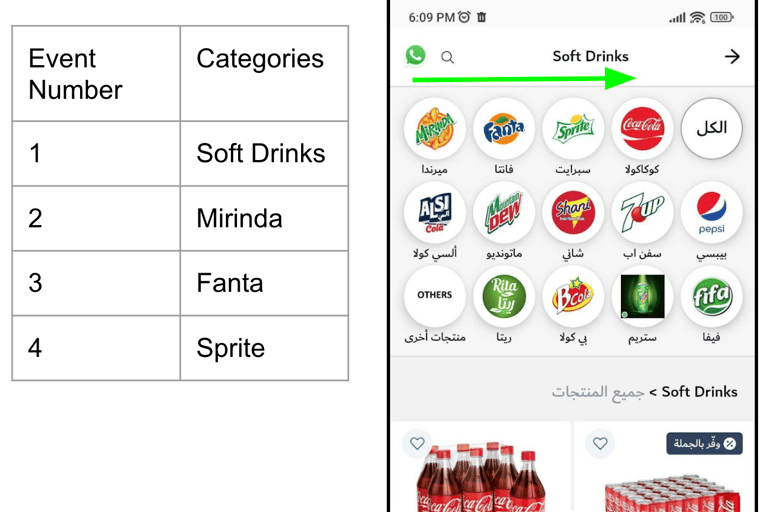
he reason why he visits household essentials everyday is to buy tissues which he cannot find in the category. It shows up in his search the most.
He searched for items such as Maggi (indomie alternative) and Pringles which he buys regularly
Operations
All Orders delivered within the next day.
95% GMV Reliability in August.
All orders delivered before 3:00 PM. (Except 1)
No correlation between yesterday’s order delivery and present day order placement.
Next Steps
Analyse the behavior of all the CM4 Positive customers and try to replicate their behavior on other users.
Figure out what is the right time and day to send the push notification to a user.
How to cross-sell the other CM4 Positive Customers.
Insights
Analytics
Experts
info@visiononeanalytics.com
+92 03132889646
© 2025. All rights reserved.